On this page
Having defined a conceptual framework we can now define a data model that seeks to realise the conceptual framework into a measurement framework that can be used to calculate the Index and its intermediate components.
Data model
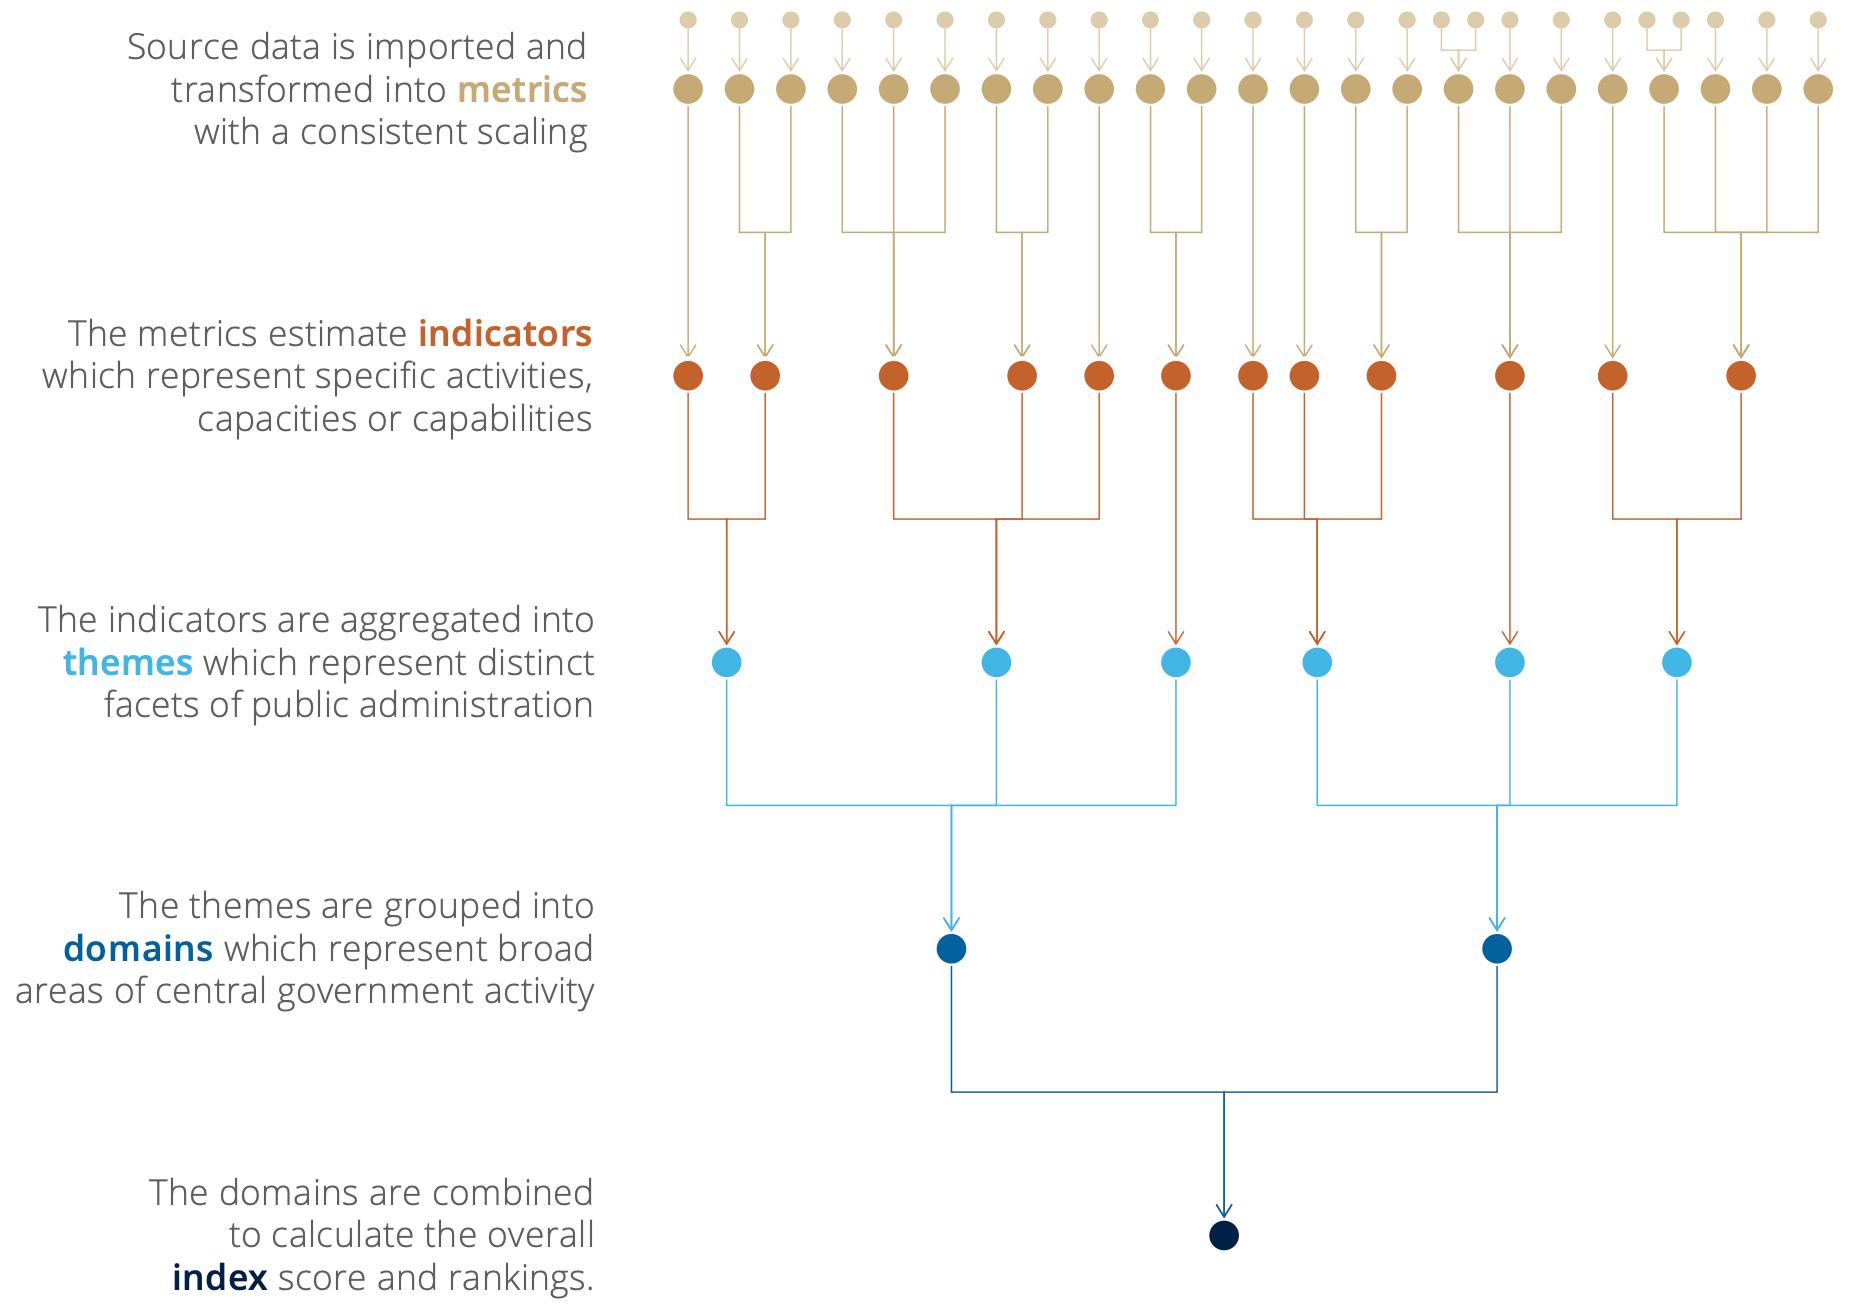
The conceptual framework outlines four domains and twenty themes, the data model expands this to define five levels. The index represents an overall comparative assessment (as far as it that possible) of a country’s public administration, it is based on four domains which represent broad areas of a public administration’s capacities and features. Each domain is based on five themes which represent a particular str and of public administration capacity. A theme is then based on a set of indicators which measure a specific activity or feature or quality of public administration. An indicator is estimated from on one or more metrics which are transformed and normalised versions of individual variables from source data1. Indicators are intended to be mutually exclusive from each other, whereas metrics may either measure further sub-divisions of the indicator or they may measure similar concepts but from different perspectives or in different ways. Figure 1 provides a visual representation of the data model.

Figure 1: Diagram of the Blavatnik Index's data model
Methodological principles
Having defined the structure of the data model we can also define core principles that guide the selection of data and the development of the Index’s methodology:
- The index should focus on the administrative functions of national, governments, see the articles on the Index’s conceptual scope and geographic scope for more detail.
- The index should be based on data that is openly available and actionable, see the articles on selecting data sources, processing data sources for more details. There is also an article on how the metrics extracted from the source data are aligned to the conceptual framework and data model.
- The index should be calculated using a simple methodology so that practitioners can easily understand how source data flows through the data model into overall scores, see the articles on country selection and data aggregation for more details.
Technical approach and workflow
As with the InCiSE Index, the Blavatnik Index of Public Administration is based on reproducible analytical pipeline and functional programming approaches, where as far as possible all stages of the Index’s data collation, processing, calculation and outputs are written in code. This approach has several benefits:
- A code-base pipeline approach makes it easier to identify and correct for errors, the entire workflow (assuming all source data has already been downloaded) of processing data sources and calculating the Index results takes less than 1 minute.
- A code-based pipeline approach can be easily re-run as and when data sources are updated, the approach taken for index calculation also makes it easy for new or different sources to be easily integrated assuming the relevant metadata files have also been changed.
- A functional programming approach makes it easier to conduct sensitivity analysis on the Index results by allowing specific aspects of the workflow to be modified while keeping others the same.
- Others can easily replicate the results by downloading the code and data sources and running the code themselves.
- Others can inspect the code used to process the data sources and calculate the Index to better understand the methodology and the choices that have been made in its construction.
- Others can modify the code for themselves, for example to run the Index on their own subset of countries, or to make different methodological choices (e.g. to exclude certain aspects/sources or to apply a weighting scheme).
The Index is operationalised through the following workflow, which is described in more detail in further sections of this report:
- The source data is downloaded from the data publisher, either as a manual download or programmatically through an API.
- The source data is processed to extract variables of interest.
- The source data is ingested and merged with metadata relating to the Index’s data model.
- Country data coverage is assessed based on the normalised data and country coverage is determined.
- The source data is then transformed and re-scaled into metrics (the base level of the Index’s data model), and subsequent tiers of the data model are then calculated.
The code for the Index’s data processing and calculation has been written end-to-end in the R programming language, output tables, charts and graphics have been written either in R or using the Observable JavaScript libraries.
The code for the Index is stored in four Github repositories:
- one to store and process the source data;
- one to calculate and store the Index results;
- one for further analysis; and,
- one to store geographic metadata and cartographic data related to the Index.
All metrics, except for two relating to gender equality, have a one-to-one relationship with variables in the source data. The two gender equality metrics are also based on a single variable from the source data, which variable is selected depends on data availability. ↩︎